PREMIUM
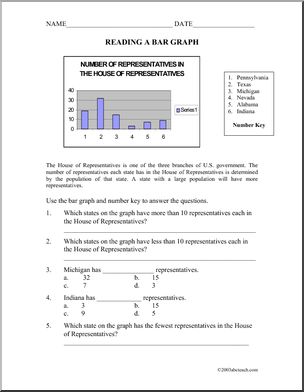
Bar Graph: House of Representatives
Overview
Students use a bar graph to determine the numbers of representatives from various states. Common Core: Grade 6 Statistics and Probability: 6.SP.A.1, 6.SPA.2
Media pdf
Similar Resources
PREMIUM
PREMIUM
Content / Middle School/Junior High / Math / Data Analysis/ Probability
Media pdf

PREMIUM