PREMIUM
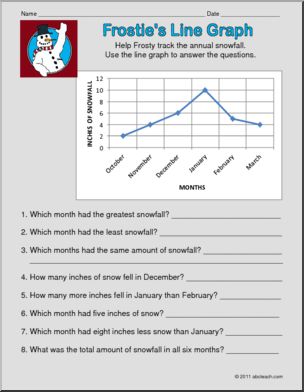
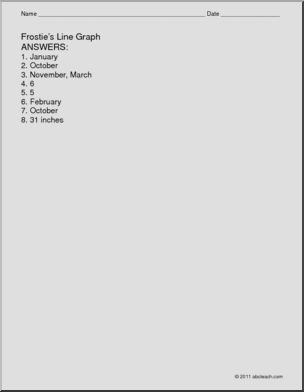
Frostie’s Snowfall Line Graph (primary/elem) Math
Overview
This Frostie’s Snowfall Line Graph (primary/elem) Math is perfect to practice graphing skills. Your elementary grade students will love this Frostie’s Snowfall Line Graph (primary/elem) Math. Frostie has measured the snowfall on a line graph during the months of October through March. Students use the colorful graph to answer questions.
Media pdf
Similar Resources

PREMIUM
PREMIUM
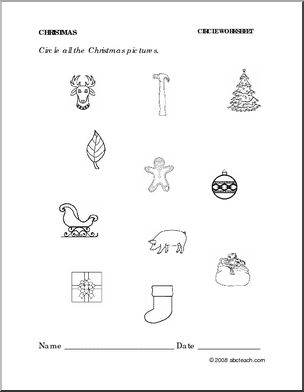
Content / Theme Units / Holidays / Christmas
Media pdf
PREMIUM