PREMIUM
Learning Center: Endangered Animal Using a Graph (elem)
Overview
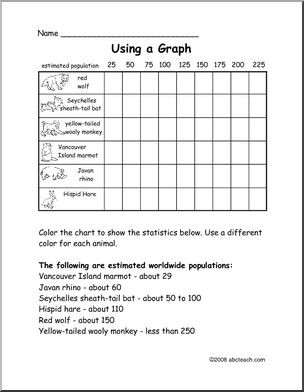
Color the chart to show the statistics for estimated worldwide population for these endangered animals.
Media pdf
Similar Resources

PREMIUM
Content / Science / Animals / Endangered Species / Endangered Animal Learning Centers
Media pdf
PREMIUM
Content / Learning Centers / By Theme / Plant Learning Centers
Media pdf
PREMIUM